Receive FREE Reflections from the Editors of the SCI by EMail



SCI editor Doug Gerlach explains why history suggests today’s small-cap bull market may have years to run.

After more than a decade of mega-cap technology company domination during which market-capitalization-weighted indices like the S&P 500 became overwhelmingly concentrated in a handful of giant firms, a long-awaited market rotation took root in 2026.
As artificial intelligence capital expenditures faced heightened scrutiny and large-cap valuations reached historic highs, capital flowed decisively in the other direction—into domestic small-cap equities. By mid-2026, the S&P SmallCap 600 Index posted year-to-date gains exceeding 19% and trailing twelve month returns above 33%, comfortably outpacing the S&P 500.
For individual investors and portfolio managers following a disciplined Quality and Growth At a Reasonable Price (Q-GARP) strategy, this rotation raises a vital question: Is the current small-cap bull rally merely a brief, tactical catch-up phase, or the opening chapter of a multi-year secular leadership cycle? And how long can it realistically endure?
Looking at historical capitalization cycles, relative valuation discounts, consensus earnings growth variances, and macroeconomic tailwinds suggests that this small-cap expansion just might have the fortitude to last several years, provided key earnings and credit conditions hold.
What the Long-Term Data Shows
History provides a baseline to estimate the duration of the current rally. Once either large-caps or small-caps take a leadership position, the change in direction is rarely short-lived.
Market leadership moves in distinct, cycles that persist for years or a decade or longer.
Chuck Royce and Royce Investment Partners examined eight capitalization outperformance cycles from 1931 through mid-2026 and revealed clear duration patterns.
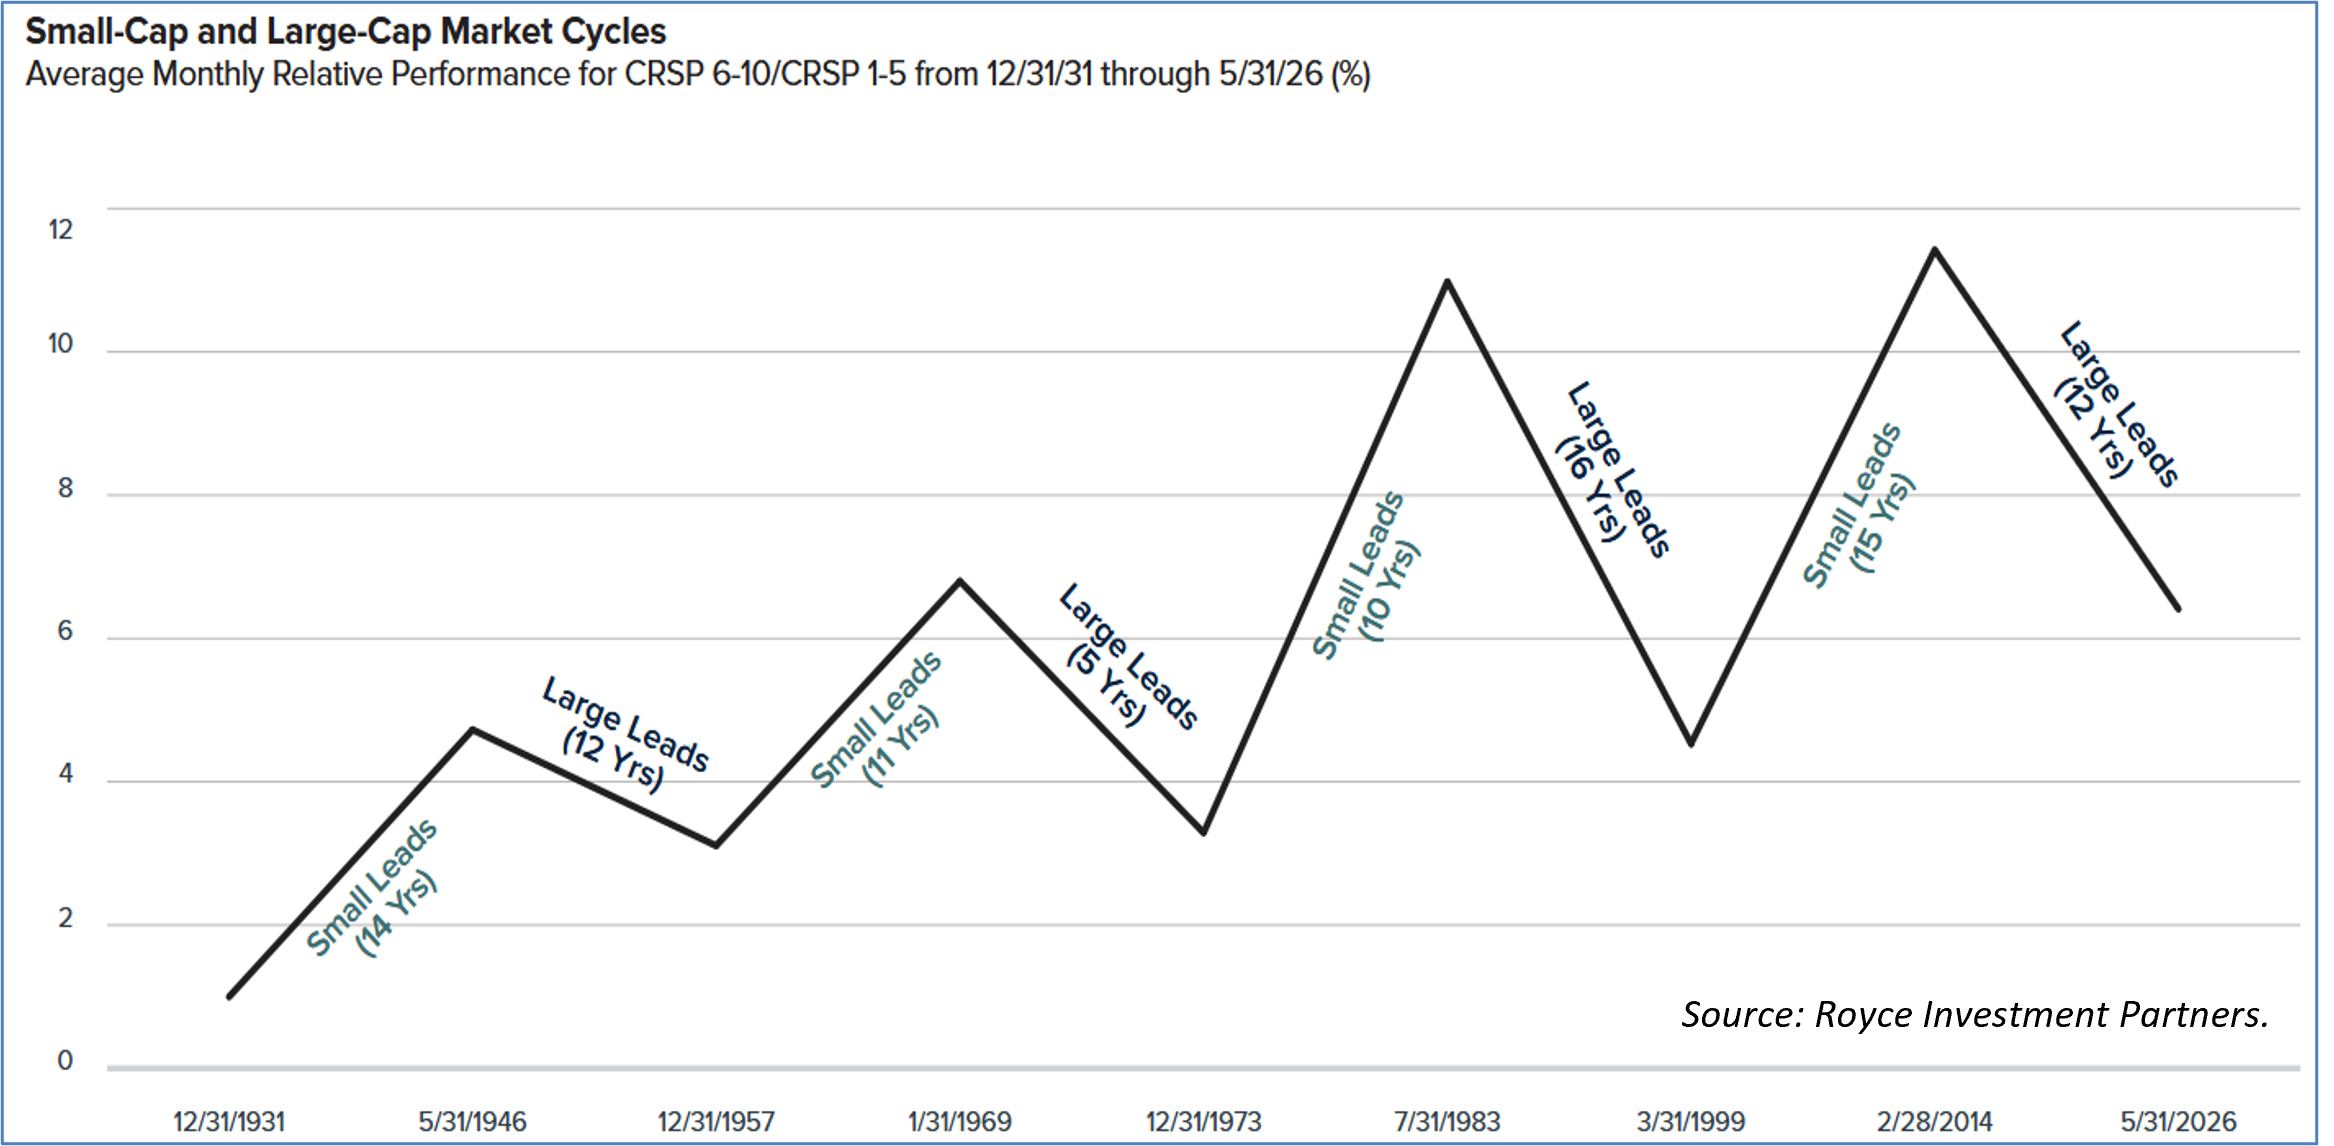
Small-cap outperformance cycles have historically averaged ten to 15 years in duration before large-caps took over. Then, large-caps outperformed for five to 16 years until the situation re-versed.
The most recent large-cap cycle lasted approximately 12 years (2014–2026), driven by tech-heavy index weighting and low-rate environments favoring global mega-caps.
A look at some of the major small-cap bull markets reveals how the relationship to broad-market and large-cap valuation excesses can drive investors down-market in search of buys.
For instance, the Post-“Nifty Fifty” Rebound happened in 1973–1983 after extreme concentration in fifty large-cap “blue chip” growth names reached unsustainable multiples. When mega-cap valuations broke, small-cap stocks (trading at deep relative discounts) embarked on an ten-year run of substantial market leadership.
Following the 1999 technology bubble, the Russell 2000 and S&P SmallCap 600 entered a long bull market (the Post-Dot-Com Rotation), going on to outperform the S&P 500 in 14 out of 21 years between 2000 and 2020.
If the current market cycle follows historical norms, the 2025–2026 small-cap breakout looks to represent the early stages of a broader multi-year cycle rather than a late-stage rally.
The Valuation Trebuchet
A key factor supporting the longevity of the current rally is the depth of the valuation disconnect from which it emerged. Like in a medieval trebuchet, the longer it takes for small-caps to wind up their unrecognized potential, the greater the force with which small company stocks will be propelled once the payload is released.
Historically, global small-caps traded at a 10% to 60% P/E valuation premium over large caps. This “Old Normal” premium was justified by smaller companies’ higher long-term revenue growth, nimble operational structures, and M&A takeover potential.
During the 2022–2025 cycle, however, this relationship inverted. By late 2024/early 2025, relative small-cap forward P/E ratios touched 33-year historical lows.
While the S&P 500 forward P/E expanded from 22 to nearly 31 (pushed up by mega-cap tech), the S&P SmallCap 600 forward P/E languished between 10 and 16, a discount of 27% to 68% relative to large caps.
According to Yardeni Research, whenever the S&P SmallCap 600 forward P/E dropped below 14.0 (as occurred in 1999, 2008, 2020, and 2022–2023), small caps subsequently experienced significant multi-year mean-reversion rallies as multiples re-expanded toward long-term historical norms.
In other words, the lower small-caps fall on the valuation scale, the faster and stronger they snap back after bottoming out.
Because current small-cap multiples are still holding at notable discounts to large caps, this typical reversion to the mean continues to provide a brisk tailwind for the asset class.
EPS Acceleration Flips towards Small-Caps
Valuation discounts create potential, but sustained bull markets require an earnings catalyst. The primary driver behind the 2025–2026 small-cap advance is a relative earnings acceleration flip.
After enduring a two-year earnings slump caused by elevated borrowing costs on variable-rate debt and supply chain disruptions, small-cap profit growth has turned upward. S&P 500 EPS growth is expected to average a steady 11% to 14% in 2026 over 2025, while the S&P SmallCap 600 is expected to grow EPS 15% to 25% for the year, 1.5 times the rate of the S&P 500.
Sectors Realign in the Physical Economy
Unlike the S&P 500—where Information Technology and Communication Services represent a heavy proportion of total market capitalization—the S&P SmallCap 600 is evenly balanced across Industrials (17–18%), Financials (15–18%), and Consumer Discretionary (13–15%).
Because smaller firms derive the vast majority of their revenues domestically, they are direct beneficiaries of the current U.S. CapEx renaissance.
Investment dollars are coming from a number of sources including Federal infrastructure packages (CHIPS Act, Inflation Reduction Act, IIJA) that moving from balance sheets into active corporate revenues; industrial reshoring and supply chain regionalization; and electrical grid modernization and infrastructure buildouts supporting data center power demand.
Wall Street prefers to group companies with similar characteristics into broad baskets, so small company stocks with low or no debt or that aren’t direct beneficiaries of trends like in-creasing CapEx (like many of those featured in the SmallCap Informer) will still see their shares lifted when rates go down.
What Could Stomp Out the Small-Cap Bull Run?
While long-term historical and fundamental trends favor small caps, several macroeconomic and structural risks could introduce volatility or shorten the rally.
Small companies carry a higher proportion of floating-rate and short-term debt than large multinationals. If sticky core inflation (such as Core PCE remaining above 3.3%) prevents central banks from easing credit conditions, higher debt refinancing costs could compress small-cap profit margins.
A critical distinction exists between small-cap indices. While the S&P SmallCap 600 enforces strict profitability criteria, roughly 40% of companies in the broader Russell 2000 Index remain unprofitable. A prolonged high-interest-rate environment could trigger debt defaults among un-profitable “zombie” companies and, drag down broader small-cap sentiment.
Since small caps rely heavily on the domestic economy, a weakening labor market or slowing consumer spending would impact small-cap retail and service components earlier than global conglomerates.
The Stock Trader’s Almanac highlights late-summer (August and September) as a seasonally weak window for equities.
Due to thinner analyst coverage and lower institutional trading volume, small-cap stocks experience exaggerated single-day drops when quarterly earnings guidance misses expectations.
How Long Will the Rally Last?
When weighing historical precedents against current fundamentals, the small-cap bull rally appears to have a multi-year runway of three to seven or more years, rather than a short-term horizon.
Since historical outperformance cycles average 10 to 15 years, even a conservative cycle—constrained by higher baseline interest rates—would likely support small-cap leadership through 2028–2030. The closing of the historical valuation discount and Relative earnings accel-eration would both feed small cap returns.
Because macro volatility and credit risks remain present, index-level returns may be choppy. Investors can maximize potential gains by adhering to a strict Q-GARP selection framework—focusing on profitable small-cap leaders with strong balance sheets, high returns on equity (ROE), minimal variable debt, and reasonable price-to-earnings ratios.
As I have often written in the past, fundamentals always win out over time. Investors who maintain a long-term business-owner perspective and take advantage of temporary market pull-backs stand to benefit as this (hopefully) multi-year small-cap cycle unfolds.
* * *
In this issue we introduce a microcap medical instruments maker that has a respectable growth track record and the potential for more of the same.
Stay the course!
— DOUG GERLACH
Subscribers can read Doug's complete commentary and the in-depth profile of our recommended small company stock in the current issue of the SmallCap Informer stock newsletter. Not a subscriber? Subscribe to the SmallCap Informer and get monthly small company stock recommendations and updated buy/sell prices for each of the ~40 high-quality small company stocks currently covered in the newsletter.
©Equity Research Service. All Rights Reserved. Privacy Policy. Terms of Use.