Life Cycle of a Successful Company
As a company gets bigger, it gets harder and harder for it to maintain the high growth rates it may have enjoyed when it was a much smaller business. For this reason, it is very important to understand where a company sits in its life cycle if you want to get a true picture of its past results and likely future expected growth.
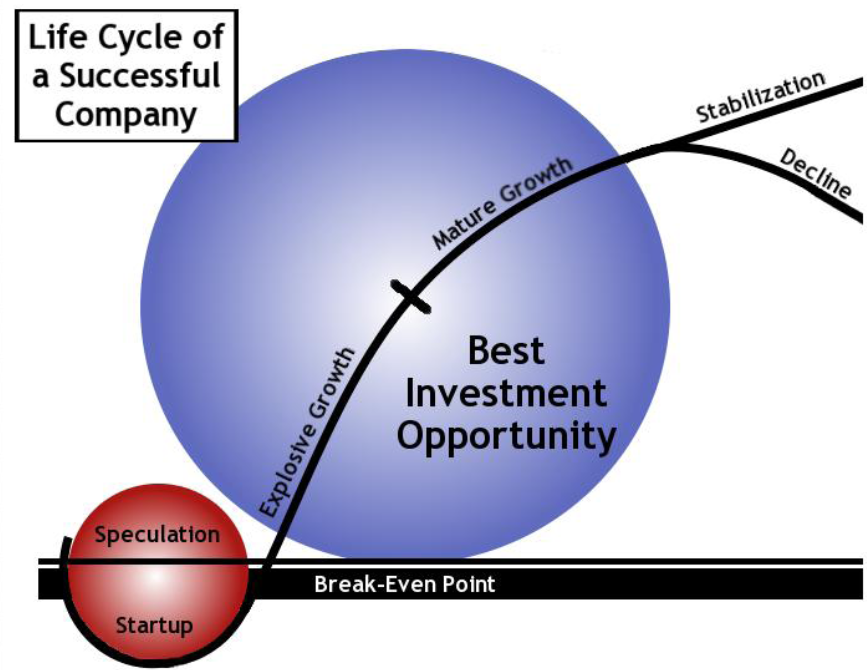
The illustration below displays the potential paths taken by companies as they are launched, mature, and eventually stabilize (or decline).
As can be seen in the diagram, a successful company will pass through several phases of growth:

- A startup phase when earnings are below the break-even point (that is, the company is losing money).
- A period of explosive growth when the percentage increase in sales and earnings can be spectacular, often approaching or exceeding 20% annually.
- A mature growth period when revenue becomes so large that it is difficult to maintain a consistent increase in the percentage of growth.
- A period of stabilization, or decline for companies that do not continue to rejuvenate their product mix or expand their target markets.
BetterInvesting-style investors are interested in investing in companies that are into their explosive growth periods but that have not gone past their primes. Small and midsized companies will be at the beginning of their explosive growth phases.
The growth rate that investors can expect from companies depends in large upon the size of the company.
Expected growth rates vary from a low of about 7% for large companies to a high of around 20%. If the company is established and has sales above $5 billion a year, growth rate of as little as 7% might be acceptable. The stock’s yield should in these cases provide an additional component of return, and some additional return should come from expanding P/E ratios (from the practice of buying the stock when it is cheap relative to its historical valuation levels and future expected growth).
At the other end of the spectrum, newer companies in the explosive growth period should show double-digit growth. The companies profiled in the
SmallCap Informer often belong to this category. Growth rates above 20% cannot be sustained forever, but higher growth rates are some compensation for the increased associated risk of investing in these smaller businesses. In our stock studies, we often project growth at rates below maximum expected results in an effort to temper enthusiasm. By being conservative in this fashion we attempt to limit surprises to those of the upside variety. If a company’s growth doesn’t meet our expectations, we will likely be disappointed in the stock’s performance, but if a company exceeds our growth projections we will pleased with the results.
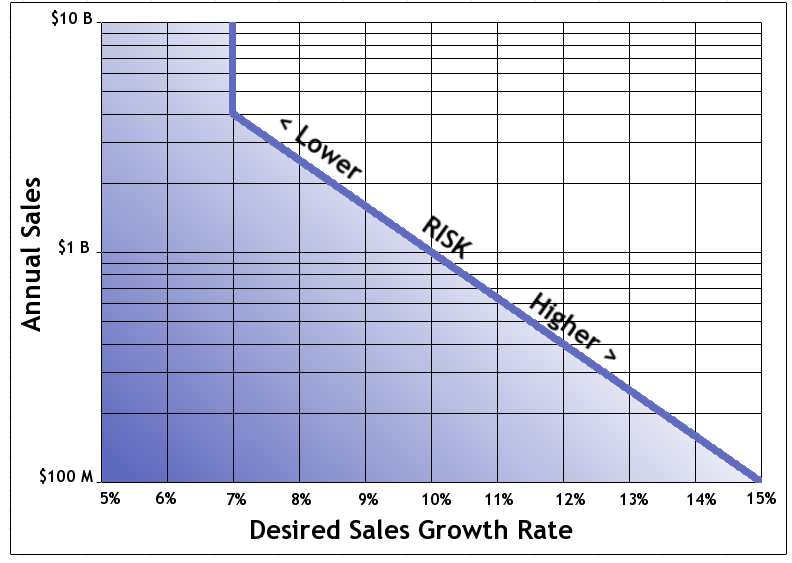
The following chart provides a rough guideline for the kinds of growth rates that you can expect from companies of different sizes.

The left side of the graph represents the annual sales of a company, from $100 million to $10 billion. The bottom of the graph shows the desired growth rates for companies of each size.
Anything in the top right side of the graph (in the light area above the blue line) is acceptable for companies whose revenues match the scale on the left side.
For example, if a company‘s sales for the current year are in the neighborhood of $300 million, we would look for a growth rate of greater than 12%. For a company with $1 billion in sales, we would want at least 8%. These are the standards of growth that we will seek for investment.
Depending upon the size or maturity of the company, you should always seek out companies whose “monotonous excellence” produces consistent annual earnings growth of anywhere from 7% to as much as 20% compounded annually.
As these companies grow, their share prices will ultimately follow, and your portfolio will reap the returns.

